December 19, 2013
Last week marked the end of the FY2014 budget season for the eight local governments monitored by the Civic Federation. These governments are the City Colleges of Chicago, Chicago Public Schools (CPS), the City of Chicago, Cook County, the Chicago Transit Authority (CTA), the Forest Preserve District of Cook County, the Metropolitan Water Reclamation District of Greater Chicago (MWRD) and the Chicago Park District.
Property Taxes
Two of the seven governments that levy property taxes held their levies flat for the FY2014 budget year: City Colleges of Chicago and the Forest Preserve District. Cook County held its levy nearly flat from FY2013. The CTA does not levy a property tax. The Park District, CPS, and the MWRD raised their property tax levies to the maximum amount allowed under the property tax extension limitation law (PTELL). Four governments – CPS, the City of Chicago, Cook County and the Park District – raised their property tax levies in part to capture new property and expiring and/or terminated Tax Increment Financing (TIF) districts, which is described in more detail below.
Capturing Revenue from Expired and Terminated TIF Districts
Four governments will raise their tax levies to capture revenue from expiring and/or terminated TIF districts. This maneuver allows governments to capture property tax revenues from expiring and terminated TIF districts without increasing the amount of money taxpayers will owe in property taxes. This is because taxpayers were previously paying the additional amounts for TIF district expenses, which are not reported in the operating budgets, and now will pay the same amounts as part of the property tax levy, which is reported in the budgets. This property tax revenue mechanism has been used by the City of Chicago for the past three years, by Cook County and the Chicago Park District for the past two years and by CPS this year. For more information about capturing revenue from expired and terminated TIF districts, see our previous blog.
Major Findings for FY2014
Major findings for FY2014 include:
- Property tax levy:
- Three of seven governments held their property tax levies flat or relatively flat.
- Three governments raised their property tax levies to the maximum amount allowed.
- General Fund budget appropriations:
- Seven of the eight governments increased their operating budget appropriations. The City Colleges of Chicago did not increase its operating budget for FY2014.
- Personnel Position Count:
- Six of the seven governments increased their workforce. The City Colleges of Chicago did not increase its workforce in FY2014. (CPS did not provide total position data in its FY2014 budget documents).
- Personnel Expenses:
- Seven of the eight governments increased their appropriations for personnel expenses. The City Colleges of Chicago decreased its appropriations for personnel expenses.
- Fund Balance:
- Five of the seven governments met the Government Finance Officers Association’s recommendation for maintaining a General Fund fund balance of at least 17% of operating expenditures: the City Colleges of Chicago, CPS, the Forest Preserve District, the MWRD and the Park District. (The Civic Federation does not conduct an analysis of the CTA’s fund balance).
- Pension Fund:
- The market value funded ratios for government employee pension funds declined for three of the seven governments with their own pension funds: CPS, the City of Chicago and the Park District. (City Colleges of Chicago employees participate in the State Universities Retirement System of Illinois).
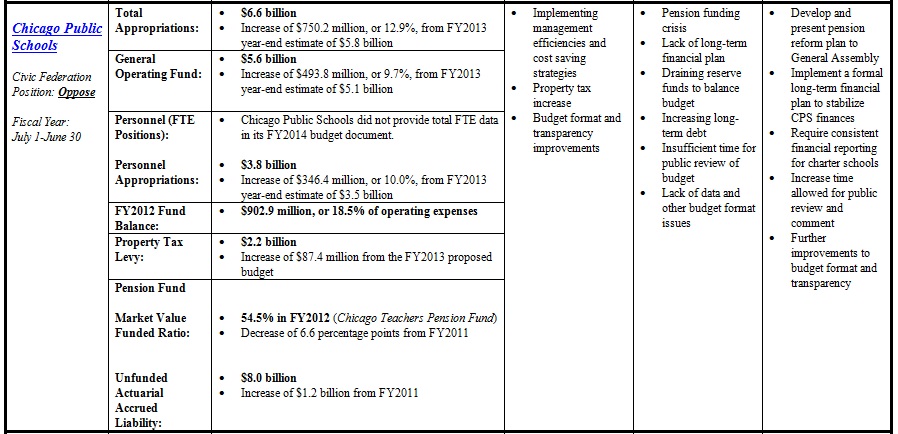
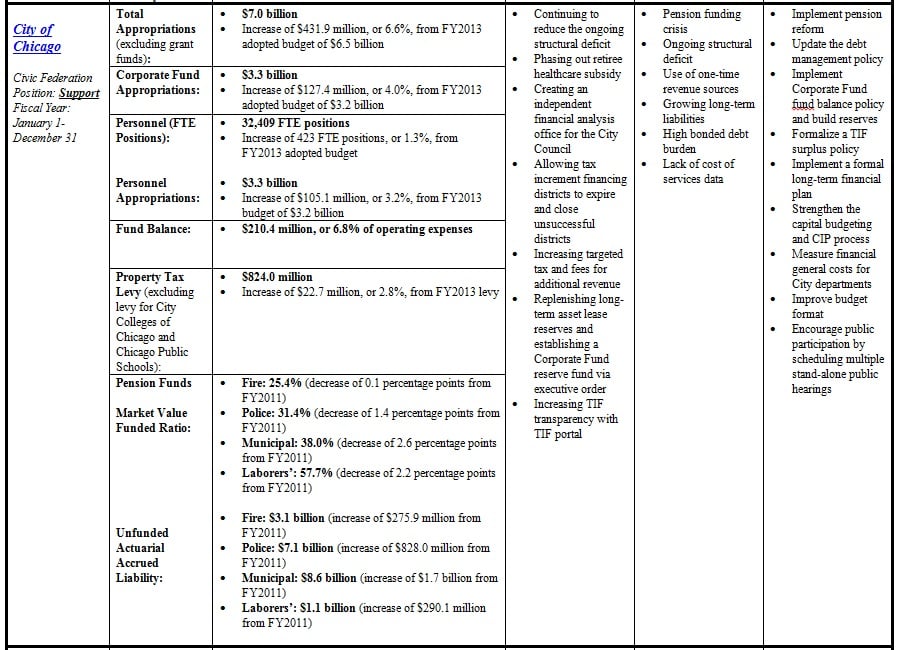
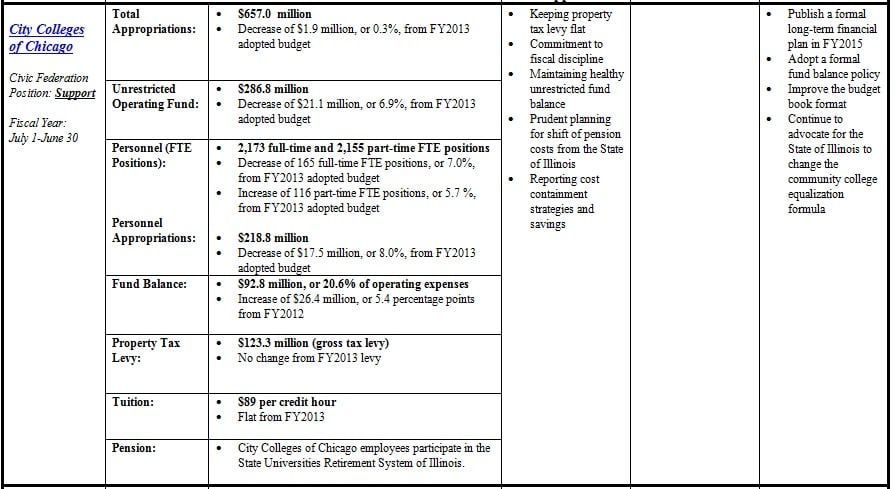
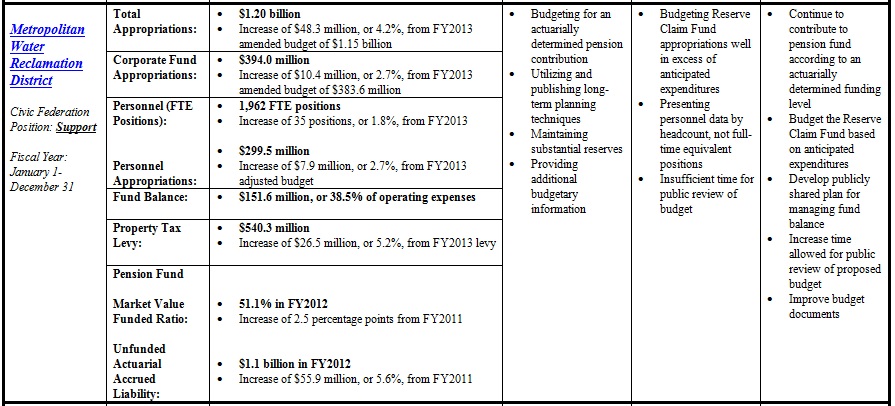
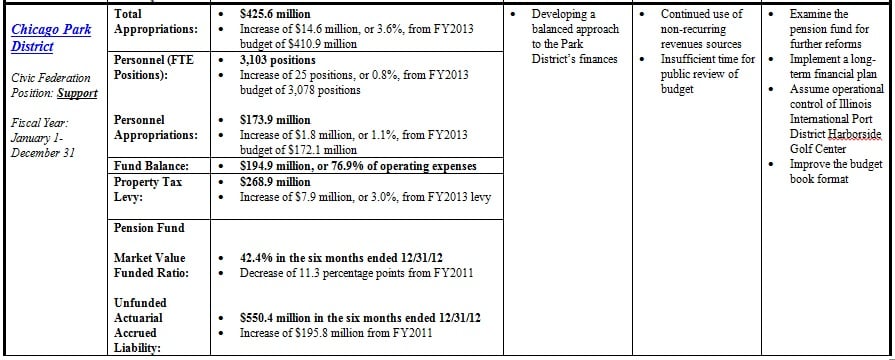
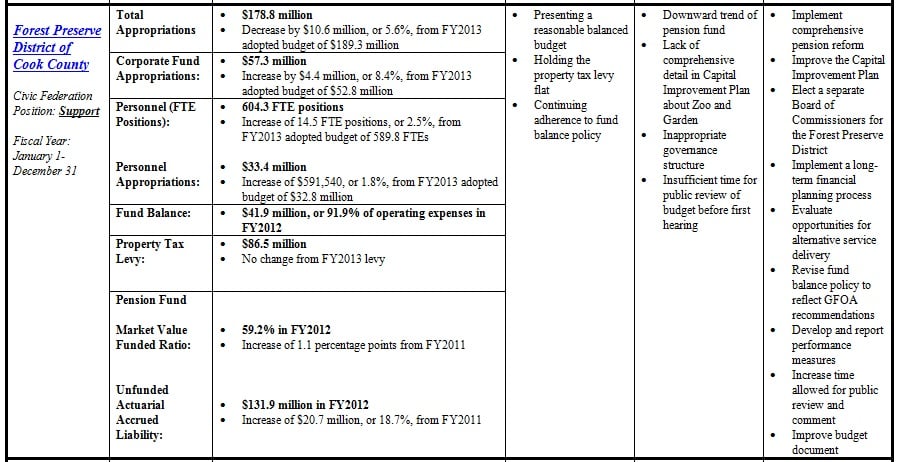
The exhibit below provides a summary of the budget analysis reports published by the Civic Federation following the release of each local government’s FY2014 proposed budget. The summary chart provides:
- Appropriation and financial data highlights;
- Changes from the previous year’s actual expenditures, year-end estimates or adjusted/adopted budgets;
- The Civic Federation’s positions; and
- The Civic Federation’s statements of support and concern, as well as recommendations.
It should be noted that the figures below represent the data available at the time the Civic Federation’s analysis of each budget was published; appropriations and other financial data may have changed since the release of each report. Also, the Civic Federation’s individual analyses for some aspects of a government’s budget may not be comparable to the analyses of other governments, and therefore may not be included in the summary exhibit. Full analysis reports can be accessed at civicfed.org.


