February 03, 2015
The Civic Federation regularly analyzes and comments on the budgets and audited financial statements of eight major local governments in northeastern Illinois:
1. City of Chicago;
2. Chicago Public Schools (CPS);
3. Cook County;
4. Chicago Transit Authority (CTA);
5. Forest Preserve District of Cook County (FPDCC);
6. City Colleges of Chicago;
7. Chicago Park District; and
8. Metropolitan Water Reclamation District (MWRD).
As part of these analyses, we examine trends in these governments’ issuance of long-term direct debt. This blog post presents 10-year data trends for total direct long-term debt for these seven governments. That period encompasses FY2004 to FY2013, the last year for which data are available from the individual governments’ annual audited financial statements.
The major findings from this analysis are that between FY2004 and FY2013:
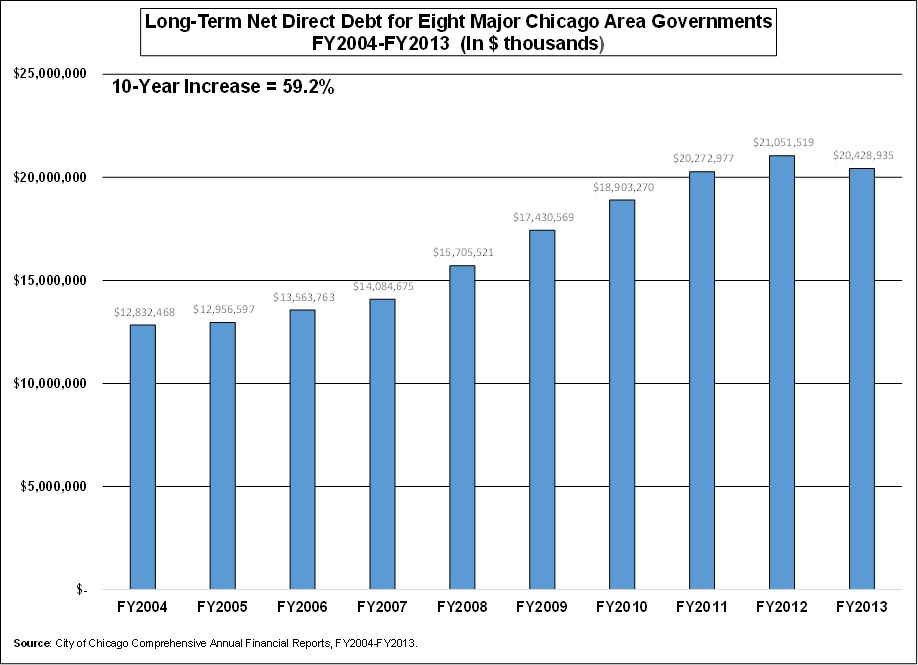
- Long-term direct debt for all eight governments rose by 59.2% to $20.4 billion; and
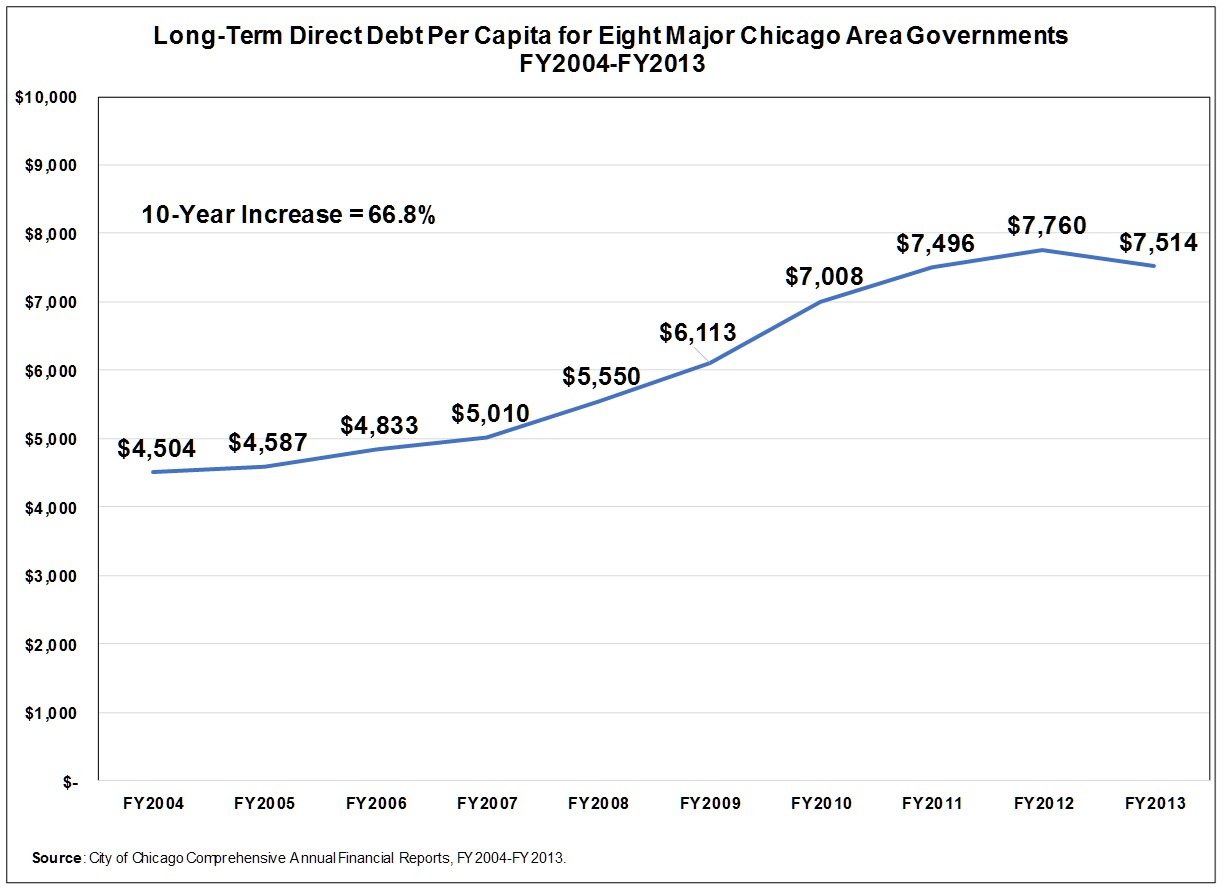
- Long-term direct debt per capita rose at a faster rate, increasing by 66.8% from $4,504 to $7,514.
For more detailed information and evaluation of long-term debt figures and trends for each government, review the long-term liabilities section of our annual local budget analyses as well as blog posts on debt, pensions and other liabilities.
Long-Term Debt
Long-term debt issued by the eight governments is tax-supported debt primarily in the form of general obligation bonds backed by the full faith and credit of each jurisdiction. Most of these debt issues are for capital improvements. However, there are exceptions. In FY2008 the CTA issued $1.9 billion in pension obligation bonds to provide funding for current and future retirement fund operating expenses.
Between FY2004 and FY2013, the total amount of tax supported debt issued by the eight governments analyzed rose by 59.2%. This was a $7.6 billion increase from $12.8 billion to $20.4 billion.

Long-Term Debt Per Capita
A common ratio used by ratings agencies and other public finance analysts to evaluate long-term debt trends is direct debt per capita, a calculation that takes the total debt of a government and divides it by a jurisdiction’s population. This ratio reflects the premise that the entire population of a jurisdiction benefits from infrastructure improvements. Large increases in direct debt per capita can be a cause for concern for a government’s financial condition if it lacks adequate fiscal capacity. Increased borrowing expenses can crowd out spending for other public priorities and/or limit the available capacity for future borrowing.
In the 10 years between FY2004 and FY2013, direct debt per capita for the eight Chicago area governments rose substantially by 66.8% from $4,504 to $7,514.

FY2013 Long-Term Debt Per Government
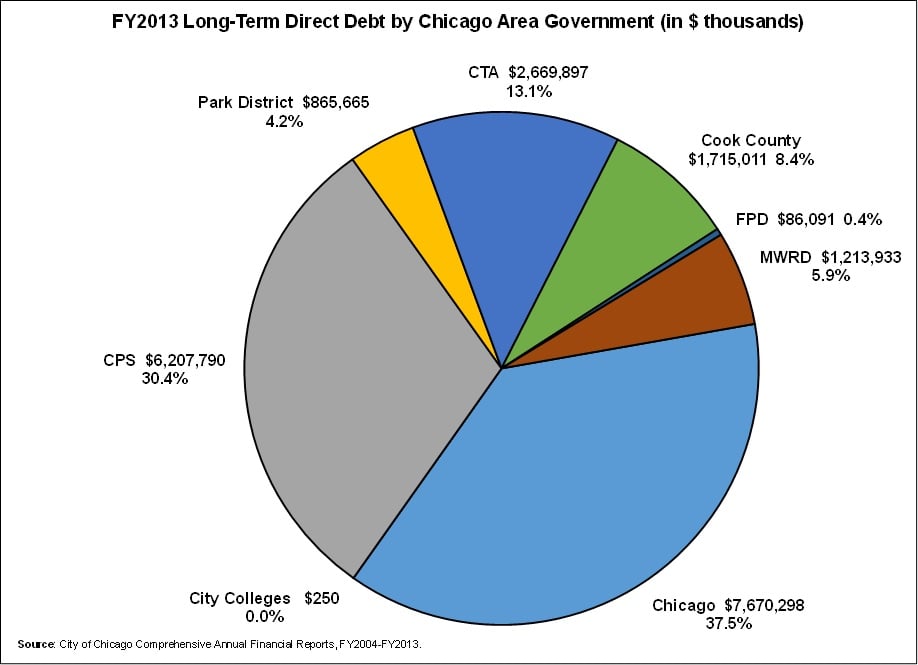
The next exhibit presents a breakdown of how much long-term direct debt was outstanding in FY2013 for each of the eight governments reviewed. In that year, the City of Chicago and the Chicago Public Schools accounted for 67.9% or $13.9 billion of the total debt outstanding amount of $20.4 billion. The Chicago Transit Authority accounted for the third largest amount of long-term direct debt, with $2.7 billion or 13.1% of the total debt outstanding.

Long-Term Direct Debt Trends for Each Government: FY2004 to FY2013
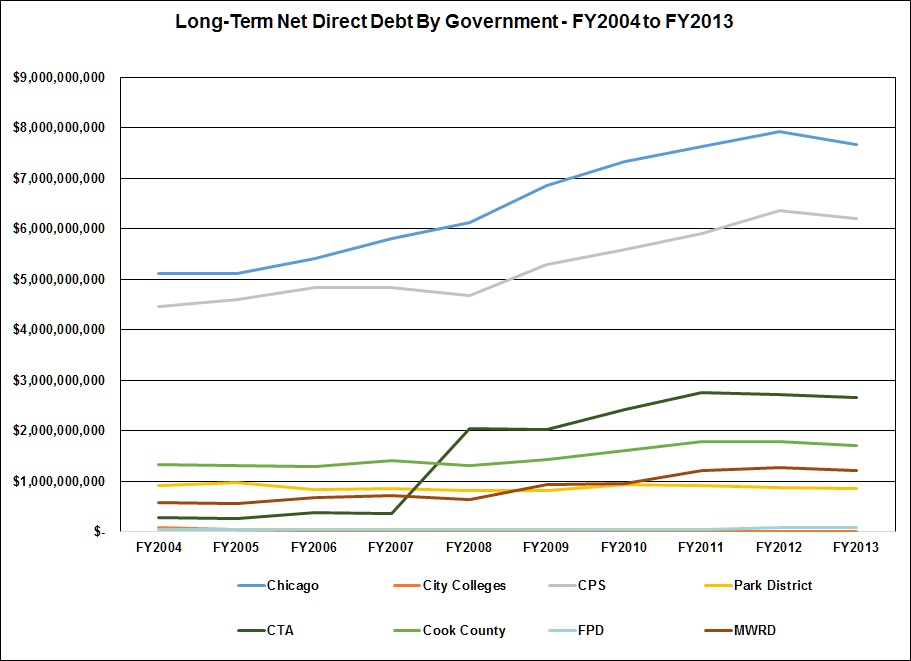
There are large variations in long-term debt trends among the eight governments. The final exhibit shows trends for long-term debt outstanding for each of the governments between FY2004 and FY2013. There were large increases for three of the governments over the ten-year period:
- City of Chicago long-term debt increased by 50.0% or $2.6 billion, rising from $5.1 billion to $7.7 billion;
- Chicago Public Schools long-term debt increased by 39.2% or $1.7 billion, rising from $4.4 billion to $6.2 billion; and
- CTA long-term debt jumped by $2.4 billion or 823.7%, rising from $289.0 million to $2.6 billion. Much of this increase was driven by the issuance of $1.9 billion in pension obligation bonds in FY2008.

